

What is Queue Time?
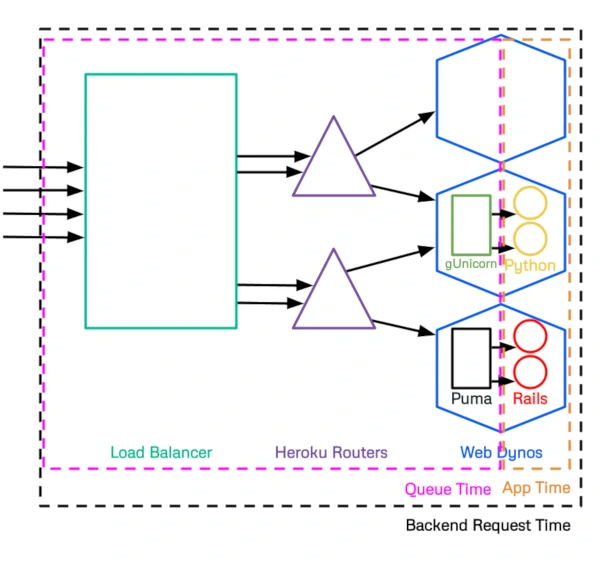
Queue time is a part of the backend response time of an HTTP request. Specifically, it is the time between a load balancer and application code. A small amount of queue time is to be expected (up to 10ms) but excessive queue time is a sign of a larger issue with your application.
What is Backend Response Time?
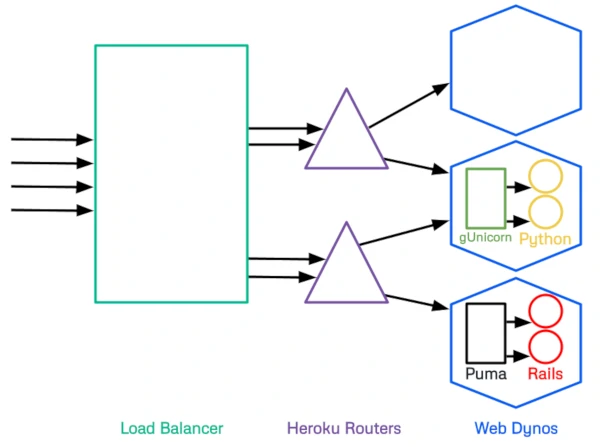
Backend response time is the total time it takes for a request to be processed by your application. We can look at the full backend response life-cycle to see the various steps. Requests to your application hit an AWS Load Balancer and are directed to a random Heroku router. The router directs requests to the dynos associated with your application. More detail on Heroku routing can be found in their documentation.
What impacts Queue Time on Heroku?
Insufficient Dynos
Heroku's routers will try to randomly assign requests to available dynos. If there are no available dyno, requests will queue up and increase queue time. This is the most common reason for increased request queuing.
Insufficient Web Server Processes/Threads
Web servers like gunicorn or puma leverage processes or threads to make the most out of a Dyno's resources (CPU/Memory). Start with 3-5 processes/threads and adjust accordingly. Ideally, you don't see R14 or R15 errors on the metrics page of your application in Heroku.
Puma thread count can be adjusted in your application's Procfile or in a configuration file.
For gunicorn, the number of processes can be set by adjusting the WEB_CONCURRENCY environment variable.
For other web servers you can check the Heroku documentation.
Slow App Code
In cases of extremely slow app code execution, it's possible for all threads/processes on all dynos to be unavailable. Hypothetically, if we envision an application that takes 30 seconds to execute app code, running on 2 dynos with 3 processes each. Then the theoretical maximum throughput of the application is 6 simultaneous requests per 30 second period. Any additional requests in that period would queue up and increase queue time.
This scenario can be diagnosed by checking for H12 errors on the metrics page of your Heroku application. Generally, scaling up your application dynos would not help in this situation. Often, these errors can be avoided by moving code to asynchronous worker processes like Sidekiq or Python-RQ.
Why use Queue Time to auto scale?
Backend Request Time is Queue Time plus App Time. Heroku's Auto Scaling functionality for Performance dynos uses Backend Request Time to determine scaling. Unfortunately, because it includes App Time, performance issues in App code trigger false positive scaling which costs you more in unneeded dynos.
Backend Request Time = Queue Time + App TimeBy eliminating App Time from the auto scaling calculation and focusing on Queue Time your application will only scale when your current dyno count is insufficient to meet the needs of your traffic.

heroku addons:create dscale